Consult In/Out Dashboard
Consult "Inbounds" Dashboard.
The user clicks the "Dashboard" option on the top left of the nav bar, then selects an Account/Site and clicks "Inbounds".
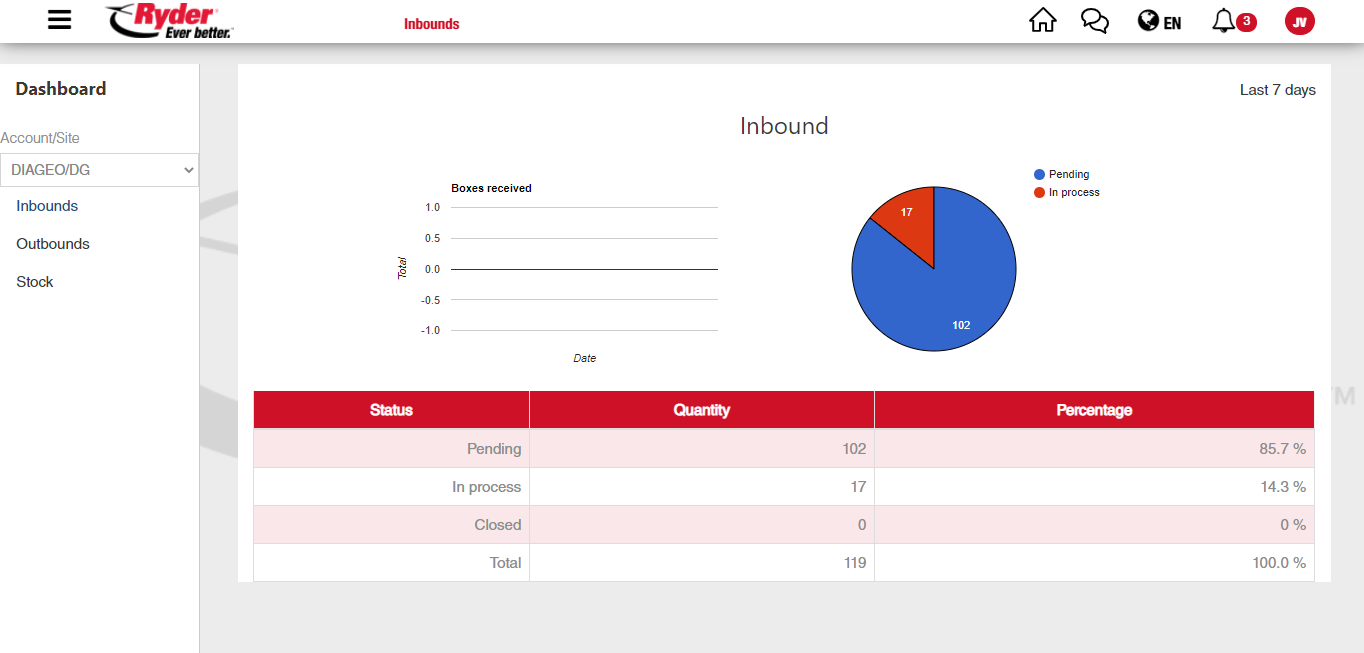
The application shows three graphs containing the following ASN information:
- BAR GRAPH OF UOM PER DAY.
- Delivered UOM Quantity (LAST 7 DAYS)
- DOCUMENTS PIE CHART
- Pending ASNs Quantity
- In Process ASNs Quantity
- Closed ASNs Quantity (LAST 7 DAYS)
- CONTENT CHART
- Status.
- Quantity.
- Percentage.
- Total.
NOTE: The information in the graphs are linked to the selected Account/Site.
The user may change Account/Site by clicking the "Account/Site" option. By selecting another Account/Site the information in the graphs and legends will update to the newly selected Account/Site.
If Orders or ASN information is unavailable in the selected Account/Site, the graphs will appear empty.
Consult "Outbounds" dashboard.
The user clicks on the "Dashboard" option located in the main menu (top left side of the nav bar). Then select an Account/Site and click "Outbounds."

A graph containing the following Orders information is displayed:
- BAR GRAPH OF UOM PER DAY.
- Delivered UOM Quantity (LAST 7 DAYS)
- DOCUMENTS PIE CHART
- Pending Orders Quantity
- In Process Orders Quantity
- Closed Orders Quantity (LAST 7 DAYS)
- CONTENT CHART
- Status.
- Quantity.
- Percentage.
- Total.