Consult In/Out Dashboard
Consult "In" Dashboard.
Consultar tablero de “Entradas".
The user clicks the "Dashboard" option on the top left of the nav bar, then selects an Account/Site. Then clicks "In". El usuario presiona sobre la opción de “Tableros” ubicado en la esquina superior izquierda de la pantalla, posteriormente selecciona la Cuenta/Site de u elección y selecciona la opción de "Entradas".
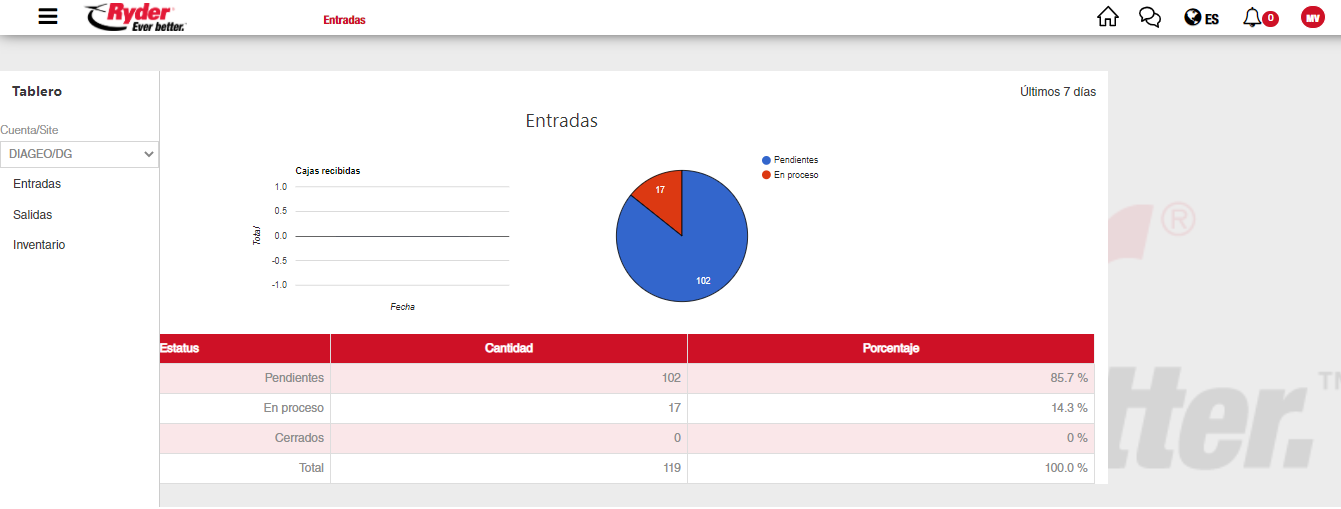
The application shows three graphs containing the following ASN information:
- BAR GRAPH OF UOM PER DAY.
- Delivered UOM Quantity (LAST 7 DAYS)
- DOCUMENTS PIE CHART
- Pending ASNs Quantity
- In Process ASNs Quantity
- Closed ASNs Quantity (LAST 7 DAYS)
- CONTENT CHART
- Status.
- Quantity.
- Percentage.
- Total.
NOTE: The information in the graphs are linked to the selected Account/Site.
The user may change Account/Site by clicking the "Account/Site" option. By selecting another Account/Site the information in the graphs and legends will update to the newly selected Account/Site.
If Orders or ASN information is unavailable in the selected Account/Site, the graphs will appear empty.
La aplicación muestra tres gráficos que contienen la siguiente información de ASN:
- GRÁFICO DE BARRAS DE UM POR DIA.
- Cantidad de UM Recibidas (LOS ULTIMOS 7 DIAS).
- GRÁFICO PIE DOCUMENTOS
- Cantidad de ASN Pendientes.
- Cantidad de ASN En proceso.
- Cantidad de ASN En cerrados: (LOS ULTIMOS 7 DIAS)
- TABLA DE CONTENIDO
- Estatus.
- Cantidad.
- Porcentaje.
- Total.
NOTA:La información de los gráficos corresponde a la Cuenta/Site indicados en el encabezado de la pantalla.
El usuario puede cambiar la Cuenta/Site presionando sobre la opción "Cuenta/SIte".
El usuario selecciona la nueva Cuenta/Site y la aplicación actualiza la información de los gráficos y el título de la Cuenta/Site seleccionada.
Si no hay información disponible de ASN y /o Órdenes en la Cuenta/Site seleccionada, los gráficos se mostrarán vacíos.
Consult "Out" dashboard.
Consultar tablero de “Salidas".
The user clicks on the "Dashboard" option located in the main menu (top left side of the nav bar). Then select an Account/Site and click "Out." El usuario presiona sobre la opción de “Tableros” ubicado en la esquina superior izquierda de la pantalla, posteriormente selecciona la Cuenta/Site de u elección y selecciona la opción de "Salidas".
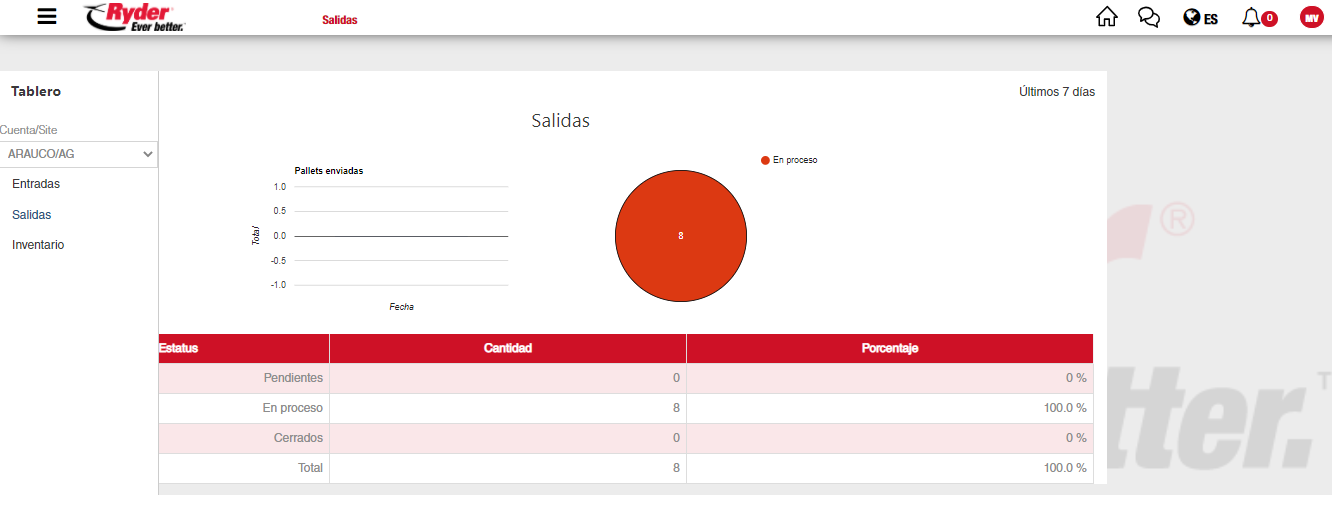
A graph containing the following Orders information is displayed:
- BAR GRAPH OF UOM PER DAY.
- Delivered UOM Quantity (LAST 7 DAYS)
- DOCUMENTS PIE CHART
- Pending Orders Quantity
- In Process Orders Quantity
- Closed Orders
OrdersQuantity (LAST 7 DAYS)
- CONTENT CHART
- Status.
- Quantity.
- Percentage.
- Total.
Se muestra un gráfico que contiene la siguiente información de Órdenes:
- GRÁFICO DE BARRAS DE UM POR DIA.
- Cantidad de UM Entregadas (LOS ULTIMOS 7 DIAS)
- GRÁFICO PIE DOCUMENTOS.
- Cantidad de Ordenes Pendientes.
- Cantidad de Ordenes En proceso.
- Cantidad de Ordenes cerrados: (LOS ULTIMOS 7 DIAS)
- TABLA DE CONTENIDO
- Estatus.
- Cantidad.
- Porcentaje.
- Total.